The role of key glyphs in the ggplot2 universe
1. Where the glyph lives in ggplot2
Every time you add a geom, it registers a draw_key = <function> that tells the legend how to draw itself.
GeomPoint$draw_key→draw_key_point()GeomLine$draw_key→draw_key_vpath()
2. How the legend calls it
When a guide is built, it loops over every layer that should appear in the legend and calls
geom$draw_key(data, params, size)where
dataone-rowdata.framewith the mapped aesthetics (colour, fill, size, alpha, shape, linetype …)paramslist of geom parameters (stroke, linewidth, …)sizephysical size of the legend key (in npc units)
The function must return a grob; the guide system then places that grob in the legend cell.
Writing your own draw_key_*()
Minimal skeleton
draw_key_myglyph <- function(data, params, size) {
  # data  : 1-row data.frame
  # params: list
  # return: a grob
  grid::pointsGrob(0.5, 0.5,
                   gp = grid::gpar(col = data$colour))
}
Key points
- Extract aesthetics with
data$colour,data$fill,data$alpha, … - Convert coordinates to npc (0–1) with
unit(). - Any grob is allowed:
pointsGrob,linesGrob,rectGrob,textGrob,gTree, …
Let ggplot2 know about your function
| Method | Usage |
|---|---|
| Function object | geom_point(key_glyph = draw_key_myglyph) |
| String shortcut | draw_key_cluster <- … then geom_point(key_glyph = "cluster") ggplot2 looks for draw_key_<name> in an internal cache. |
| Global override | GeomPoint$draw_key <- draw_key_cluster permanently swaps the default glyph for that geom. |
Complete examples
Scatter with clustered legend icon
library(ggplot2)
library(grid)

draw_key_cluster <- function(data, params, size) {
  n <- 4
  set.seed(42)
  x <- runif(n, 0.35, 0.65)
  y <- runif(n, 0.35, 0.65)

  pointsGrob(
    x = unit(x, "npc"),
    y = unit(y, "npc"),
    pch = data$shape %||% 16,
    gp = gpar(
      col   = alpha(data$colour, data$alpha),
      fill  = alpha(data$fill,  data$alpha),
      fontsize = (data$size %||% 1.5) * .pt
    )
  )
}

ggplot(mtcars, aes(wt, mpg, colour = factor(cyl))) +
  geom_point(key_glyph = "cluster") +
  guides(colour = guide_legend(override.aes = list(size = 1.5)))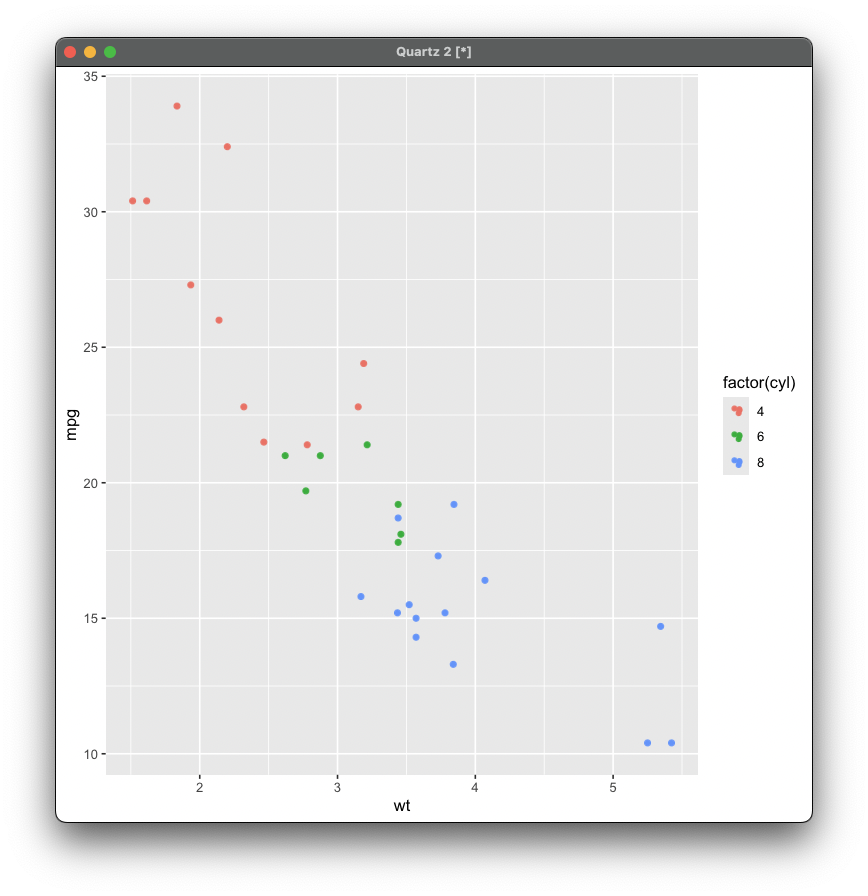
Long-dashed line legend
library(ggplot2)
library(grid)

draw_long_dashed_line <- function(data, params, size) {
  segmentsGrob(x0 = unit(-1.5, "npc"),
               x1 = unit(0.9,  "npc"),
               y0 = unit(0.5,  "npc"),
               y1 = unit(0.5,  "npc"),
               gp = gpar(col   = alpha(data$colour, data$alpha),
                         lwd   = 1,
                         lty   = "dashed"))
}

ggplot(economics, aes(date, unemploy, linetype = "dashed")) +
  geom_line(key_glyph = draw_long_dashed_line) +
  scale_linetype_manual(values = c(dashed = 2)) +
  theme(legend.position = c(0.9, 0.1))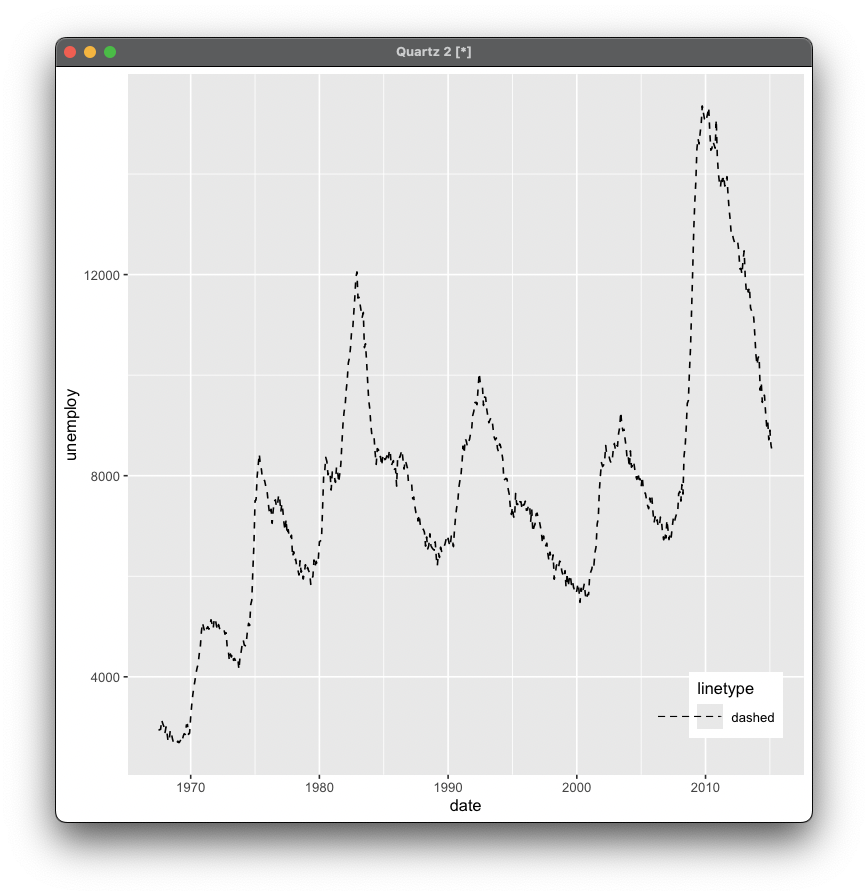
Mini boxplot glyph
draw_key_box <- function(data, params, size) {
  gTree(
    children = gList(
      segmentsGrob(0.35, 0.2,  0.65, 0.2,  gp = gpar(col = data$colour)), # lower whisker
      segmentsGrob(0.35, 0.8,  0.65, 0.8,  gp = gpar(col = data$colour)), # upper whisker
      segmentsGrob(0.35, 0.35, 0.65, 0.35, gp = gpar(col = data$colour)), # lower box
      segmentsGrob(0.35, 0.65, 0.65, 0.65, gp = gpar(col = data$colour)), # upper box
      segmentsGrob(0.35, 0.35, 0.35, 0.2,  gp = gpar(col = data$colour)), # left whisker
      segmentsGrob(0.35, 0.65, 0.35, 0.8,  gp = gpar(col = data$colour)), # left whisker
      segmentsGrob(0.65, 0.35, 0.65, 0.2,  gp = gpar(col = data$colour)), # right whisker
      segmentsGrob(0.65, 0.65, 0.65, 0.8,  gp = gpar(col = data$colour)), # right whisker
      segmentsGrob(0.35, 0.5,  0.65, 0.5,  gp = gpar(col = data$colour, lwd = 2)) # median
    )
  )
}

ggplot(mtcars, aes(factor(cyl), mpg, colour = factor(cyl))) +
  geom_boxplot(key_glyph = "box")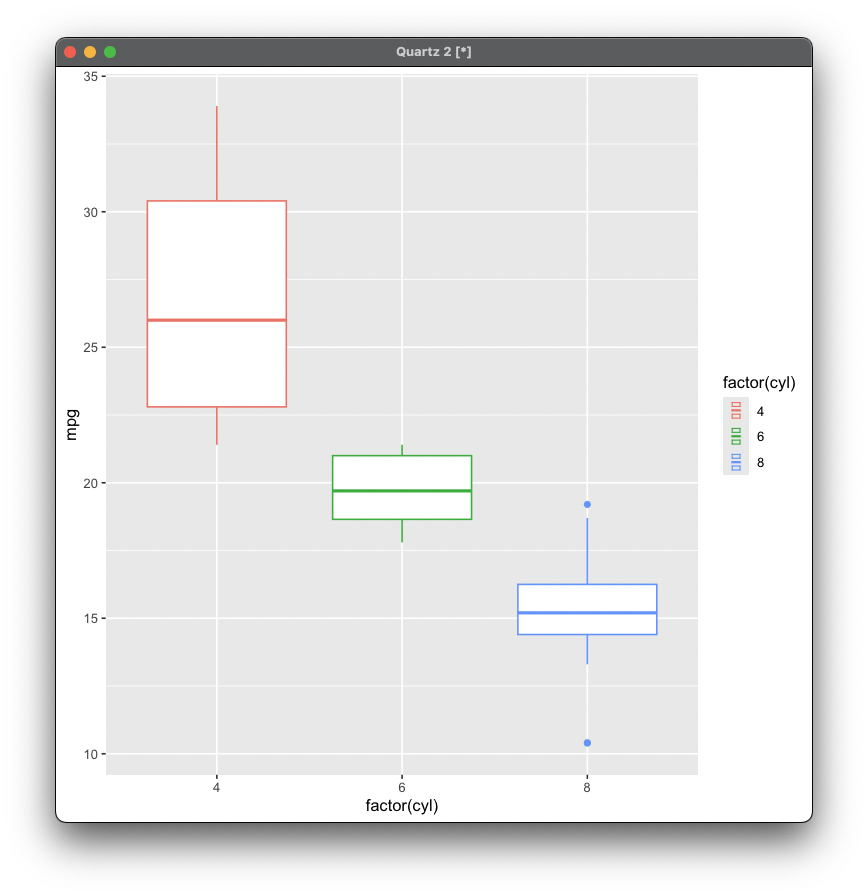
Smiley face glyph
draw_key_smiley <- function(data, params, size) {
  face  <- circleGrob(0.5, 0.5, r = 0.4,
                      gp = gpar(col = data$colour, fill = "yellow"))
  left  <- circleGrob(0.35, 0.6, r = 0.05,
                      gp = gpar(col = NA, fill = "black"))
  right <- circleGrob(0.65, 0.6, r = 0.05,
                      gp = gpar(col = NA, fill = "black"))
  mouth <- linesGrob(x = c(0.3, 0.5, 0.7), y = c(0.35, 0.25, 0.35),
                     gp = gpar(col = "black", lwd = 2))
  gTree(children = gList(face, left, right, mouth))
}

ggplot(mtcars, aes(wt, mpg, colour = factor(cyl))) +
  geom_point(size = 4, key_glyph = "smiley") +
  theme(legend.position = "bottom")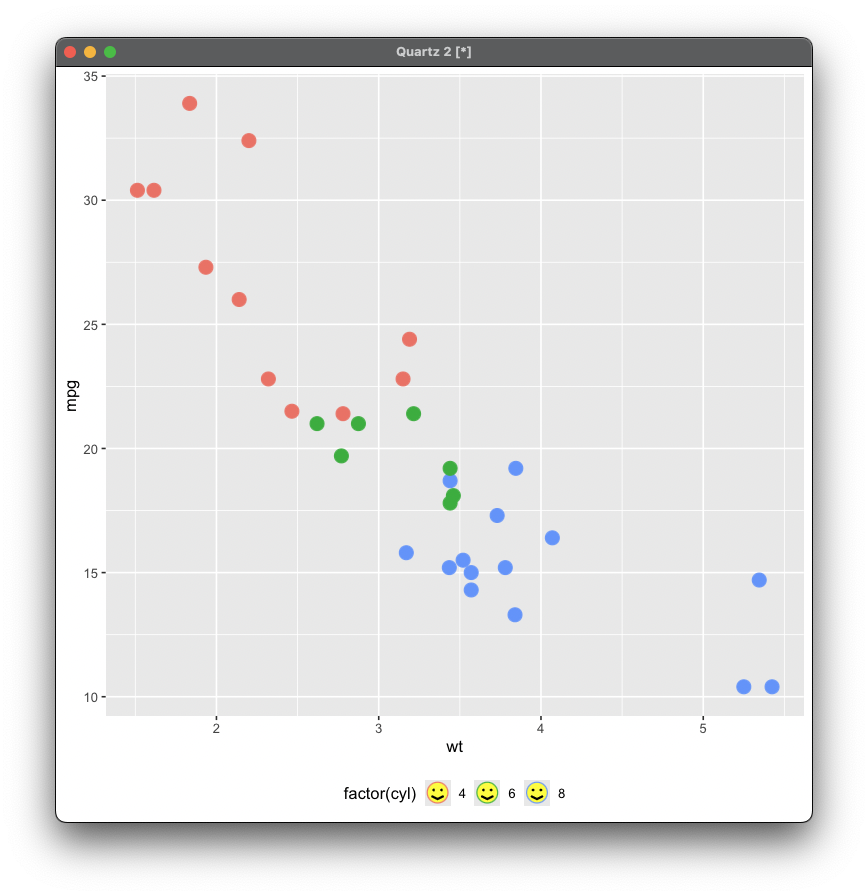
Five-point star glyph
draw_key_star <- function(data, params, size) {
  n <- 5
  outer <- 0.4
  inner <- 0.2
  theta <- seq(0, 2 * pi, length.out = 2 * n + 1)[-1]
  r <- rep(c(outer, inner), n)
  x <- 0.5 + r * cos(theta)
  y <- 0.5 + r * sin(theta)
  polygonGrob(x, y,
              gp = gpar(col   = data$colour,
                        fill  = alpha(data$fill %||% data$colour, data$alpha)))
}

ggplot(mtcars, aes(wt, mpg, fill = factor(cyl))) +
  geom_point(shape = 21, size = 4, key_glyph = "star")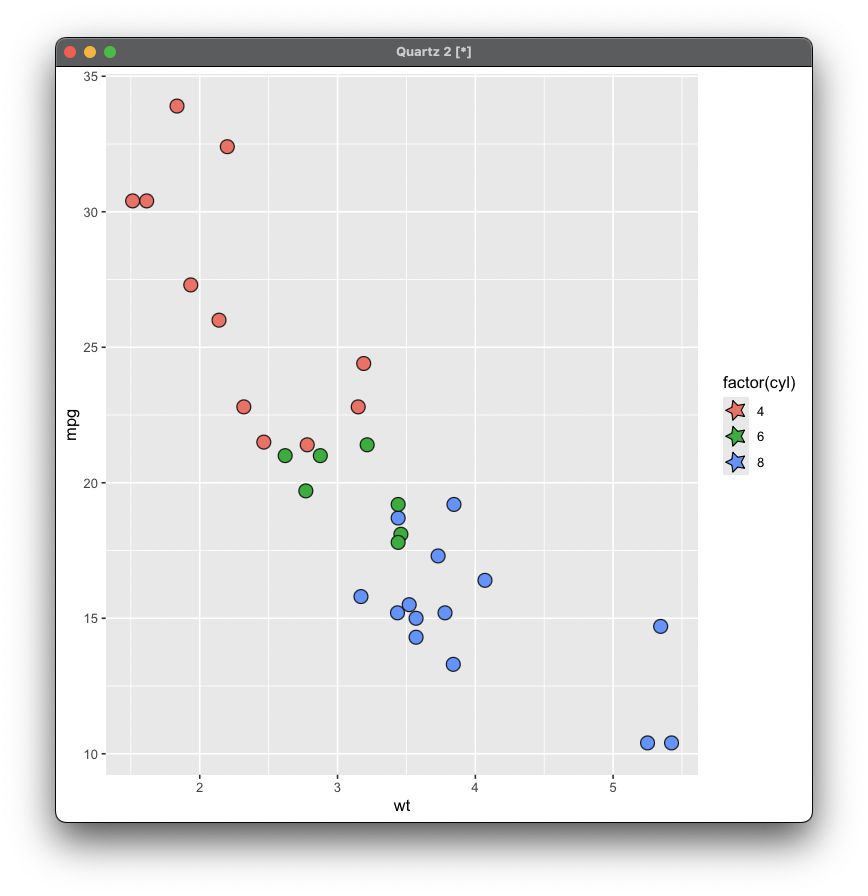
Quarter pie-slice glyph
draw_key_pie_slice <- function(data, params, size) {
  theta <- seq(pi/4, pi/2, length = 30)
  x <- c(0.5, 0.5 + 0.4*cos(theta), 0.5)
  y <- c(0.5, 0.5 + 0.4*sin(theta), 0.5)
  polygonGrob(x, y,
              gp = gpar(fill = alpha(data$fill,  data$alpha),
                        col  = alpha(data$colour, data$alpha)))
}

ggplot(mtcars, aes(wt, mpg, fill = factor(cyl))) +
  geom_point(shape = 21, size = 6, key_glyph = "pie_slice")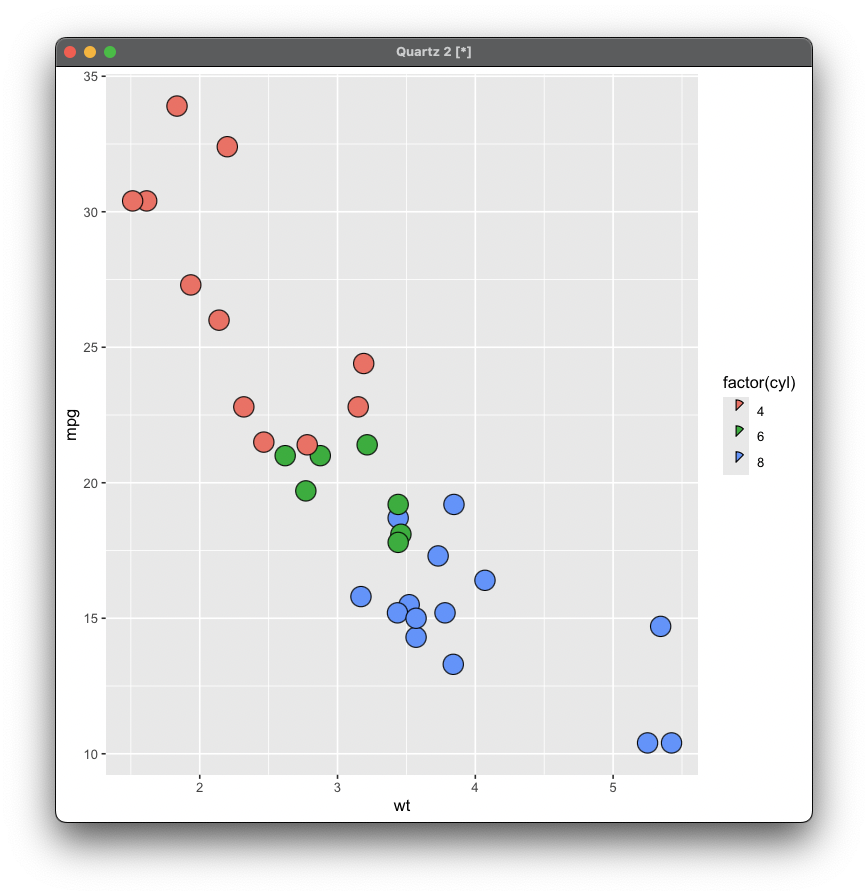
Enjoy crafting your own legend glyphs!